


Every new product introduction creates tension between schedule and quality - but you refuse to compromise either one. The ability to quickly define the tests you need and minimize their execution time can help ease the tension. The 89601X VXA vector signal analyzer measurement application helps you verify product designs and ensure product quality through a deep, flexible set of tools that puts comprehensive vector signal analysis in the test rack. Operating within an Agilent X-Series signal analyzer (MXA/EXA), the VXA measurement application lets you tweak and tune its standard measurements for today’s complex signals. Verify designs, ensure product quality, and optimize without compromise - with the VXA measurement application for the X Series analyzers.
The VXA measurement application combines the advanced measurement algorithms from Agilent’s industry-leading 89600 VSA software with SCPI programming and the familiar X-Series signal analyzer front-panel user interface. The result: measurements you can trust to thoroughly test your design, plus familiar tools to quickly automate the tests you choose.
Use the VXA application for:
Manufacturing: Prove the product
The VXA measurement application uses familiar SCPI programming to access its capability in the test rack. Use it to create manufacturing test programs that test the parameters important to your particular design. You can leverage tests developed in design verification, or create new ones. If your manufacturing tests reveal a problem, the VXA measurement application’s complete signal troubleshooting toolset is available to you to help get your line back up and running.
Design verification: Prove the design before release
Conformance testing, certification testing, QA testing – all are needed before you can move your designs into production. Expand your test flexibility with the VXA firmware’s wide, deep set of measurements. Add the extensive list of X-Series measurement applications for complete coverage of your measurement needs: spectrum analysis, power suite, phase noise, and more. Develop automated tests with the VXA application to quickly verify internal requirements, and even highlight opportunities for design improvement.
With the VXA vector signal analyzer, you get more than just a pass/fail on the design — you also get the troubleshooting tools you need to investigate what caused a failure. You can adjust the analysis region or measurement setup parameters to understand the nature of errors. You can put any available trace information in any display, or overlay traces to more quickly compare results. Powerful markers can be coupled across multiple measurement displays to uncover relationships between time, frequency, and modulation domain behaviors.
R&D: Troubleshoot products, designs, and signals
Completely characterize your products, designs, and signals with a wide range of measurements, demodulation types, and filters. Perform qualitative and quantitative signal analysis through flexible displays and markers. Use the VXA signal analyzer’s demodulation options to perform error analysis, or use its statistical measurements to quantify design headroom or track down error sources.
X-Series analyzer industry-leading speed
Run the VXA measurement application on the X-Series signal analyzers to take advantage of the industry’s fastest signal and spectrum analysis at an excellent price value. Choose the MXA signal analyzer for the highest performance in a midrange signal analyzer, and eliminate the compromise between speed and performance. Or, choose the economy-class EXA signal analyzer to enhance your yield and throughput, and eliminate the compromise between speed and price.
The 89601X VXA vector signal analyzer measurement application teams with your X-Series analyzer to help you verify product designs and ensure product quality. Add the VXA application to other X-Series signal analyzer measurement applications for combined wideband spectrum and detailed vector signal analysis, letting you optimize without compromise.
More Than Just Measurements
Available features:
Option 205 Basic VSA-Lite
Option 205 is the foundation of all other measurement options in the VXA measurement application and is a required option.
Available measurements
Each measurement is available simultaneously, in either 1, 2, 3, or 4 user-selected separate trace displays. You have full control of trace data format and scaling. Measurements include:
● Spectrum, instantaneous spectrum.
● Time, instantaneous time, raw time.
● Time gating.
● Time averaging, including continuous peak hold, exponential, RMS (video) , RMS (video) exponential, time, time exponential.
● Band power.
● Power spectral density (PSD).
● Power statistics (including gated):
- Complementary cumulative distribution function (CCDF).
- Cumulative distribution function (CDF).
- Probability distribution function (PDF).
● Auto-correlation.
● Occupied bandwidth (OBW).
● Adjacent channel power (ACP).
● Analog demodulation: AM/FM/PM (includes spectrum, time, gated time, PSD, power statistics).
● Frequency counter.
● Signal tracking.
● Marker coupling.
● Ability to save traces.
Option 333 X-Series Analyzer Connectivity
Option 333 is a required option that provides hard key/soft key front panel operator control, SCPI programming, and connectivity to the X-Series signal analyzers.
Tools to help you be successful
Take advantage of the rich Help Text and user documentation that comes with the VXA measurement application. When you need more specialized and personalized assistance, Agilent has a worldwide team of application engineers standing by to help you.
Add powerful modulation analysis options
The real power of the VXA measurement application is its ability to analyze complex, time-varying signals. Add powerful modulation analysis options with feature sets that have been customer-tested as part of the 89600 VSA software:
Vector modulation analysis (Option AYA)
This high-performance option provides a wide selection of demodulators, filters, and error analysis tools to evaluate and troubleshoot your signal. You can quickly evaluate and troubleshoot digitally modulated signals with both qualitative displays and quantitative measurements. Then, visualize system performance rapidly and intuitively with familiar display formats.
WLAN modulation analysis (Option B7R)
This advanced option offers spectrum, time, and modulation quality measurements for WLAN signals including:
● IEEE 802.11a OFDM modulation analysis.
● IEEE 802.11b DSSS/CCK/PBCC modulation analysis.
● IEEE 802.11g modulation analysis.
● IEEE 802.11p DSRC modulation analysis.
● IEEE 802.11j 10 MHz modulation analysis.
Bringing Comprehensive Vector Signal Analysis to the Test Rack
View detailed frequency behavior
The VXA measurement application gives you a complete set of tools to maximize the resolution of your spectrum display, and the accuracy of the data displayed:
● Up to 409601 frequency points across whatever frequency span you select provides unprecedented frequency resolution to locate the most difficult problem. RBW’s of less than 1 millihertz are available.
● Automatic selection of highest frequency resolution for a given measurement.
● Choose from four different FFT window functions to meet the needs of the particular measurement - Gaussian filter for high dynamic range measurements, or Flat Top filter for highest amplitude accuracy measurements.
● Use the x-axis scaling feature for a better view of the area of interest on your signal. Save this display or paste the measurement result into a report to the design team.
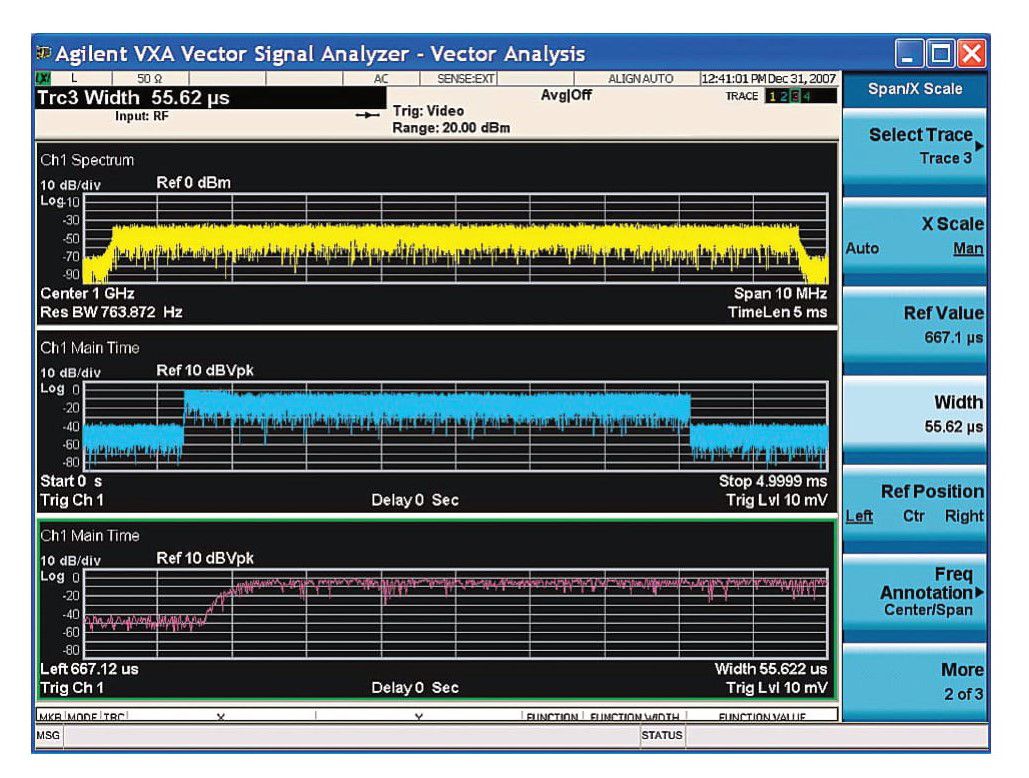
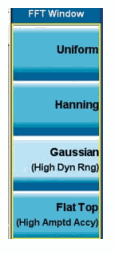
Figure 2. The FFT window filter is applied to each frequency bin, similar to the filter that a spectrum analyzer uses as it sweeps across the frequency span of the measurement; however, with VXA, the filters are applied simultaneously to all frequencies and can be changed.
Troubleshoot signals with powerful time domain capability
Use the advanced time domain measurement tools that come standard in the VXA measurement application to evaluate signal performance:
● Simultaneous time and frequency domain displays provide insight into your signals that spectrum analyzers alone can’t deliver.
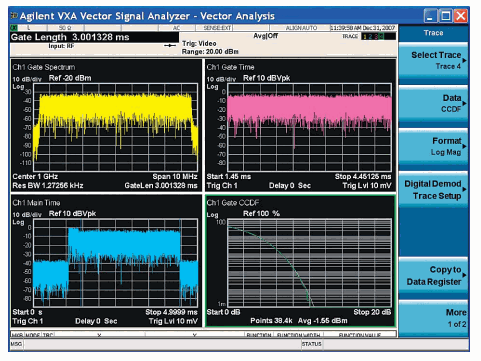
● Powerful time gating: Besides spectrum, you can display CCDF, power spectral density, or auto-correlation measurements. Move the gate position during a paused measurement and the gated displays update immediately.
● Statistical power measurements such as CCDF, CDF, PDF help you identify design headroom and provide important information on how to improve the design. Use it with time-gating to gain a more realistic view of how your design/parts will be stressed. Many signals have preambles or other portions of the signal which have a lower CCDF than other areas. This can bias the overall CCDF lower, and will not properly represent the strain that some components, such as power amplifiers, will undergo.
● Auto-correlation measurements help you identify time-delayed versions of signals, indicating reflections or echoes.
● Use x-axis expand to focus in on a portion of the time waveform, such as turn on/off.
● High resolution time - domain measurements with flexible y-axis scaling let you see the details of your signal.
Analog demodulation identifies unintentional modulation
The VXA application offers AM/FM/PM demodulation as a standard feature. Use it as a powerful troubleshooting tool to identify unwanted amplitude, phase, or frequency components in a signal. For example use PM demodulation to determine if the signal phase has settled prior to the data being sent. If not, you can then use coupled markers to determine the length of time needed for the signal phase to settle sufficiently.
Use the AM/FM/PM demodulation capability to:
● Analyze unintentional modulations like phase noise or AM to PM conversion. In modern I/Q modulated systems, the phase of the carrier must be stable for information to be correctly encoded upon it. Many of these same systems use RF burst techniques in order to increase system capacity. When these rapid amplitude changes occur, power supplies are stressed, oscillators are pulled, and reactive components are stimulated inducing unwanted phase shifts in the carrier. This AM to PM characteristic must be understood for the system to perform well.
● Apply phase and frequency demodulation to oscillator or synthesizer designs to examine phase and frequency trajectories during frequency hops, or to establish phase-lock-loop lock-up time.
● Demodulate a burst signal to evaluate wait time to determine when a signal stabilizes.
● Amplitude - and phase - demodulate sidebands to determine the type of modulation present in phase noise.
● Examine frequency versus time behavior of chirp signals.
● Examine frequency settling, phase settling, or pulse shaping on single-shot events or pulses.
● Quickly identify the source of interfering signals using the AM-, PM-, or FM-spectrum measurement. This provides the frequency of the signal generating unintended modulation, which is important information to a designer who needs to track down and eliminate that interference.
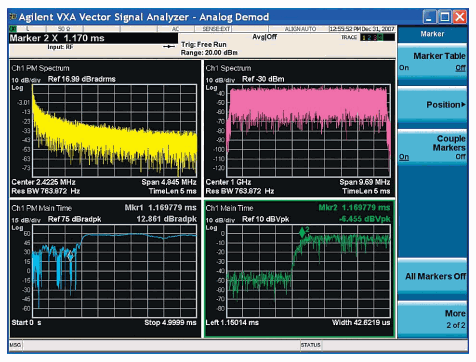 Figure 4. PM demodulation used to show phase stability of the burst at turn-on; by coupling markers to an expanded time domain trace, we can see that data is sent prior to the phase settling out to a stable value after the burst turn-on occurs.
Flexible displays and markers customize your results view
One of the biggest differences between vector signal analyzers and spectrum analyzers is that all measurements and displays begin with sampling the signal in the time domain. All measurements provided by the VXA application are derived from this sampled time series data and made available for display. Because of this, you can independently display any available information in any trace window, at any time.
The VXA vector signal analyzer display offers flexible marker and display capabilities:
● Choose from 1, 2, 3, or 2x2 grid displays, providing you the data you need, anywhere. Save commonly used display setups for use in future testing or re-testing.
● Select any available measurement for display in any grid, letting you see mixed time, frequency, statistical power, and demodulation results simultaneously - gain an overall view of your signal’s behavior, quickly.
● Choose from 12 markers, selectable as normal, delta, or fixed for quantitatively locating boundaries or error conditions.
● Marker table delivers quick and easy readout of marker values.
● Use peak search, min search, and marker to reference level dedicated keys and quickly locate the most common signal conditions.
● Select any bandwidth or center frequency you need with powerful marker functions, including band power, band power density, adjacent channel power (ACP), and occupied bandwidth (OBW).
● Band power markers work on time, frequency, or other rectangular format traces to calculate the rms value.
● Couple markers from display to display, providing greater insight into the signal.
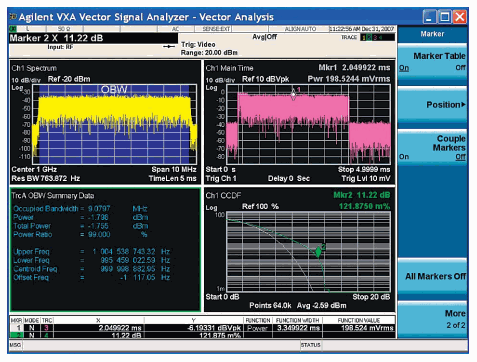 Figure 5. 2x2 grid display showing multiple measurements, markers, and marker table for at-a-glance signal analysis

